EV Charging with Solar Panels: How Much Do You Really Save in 2026?
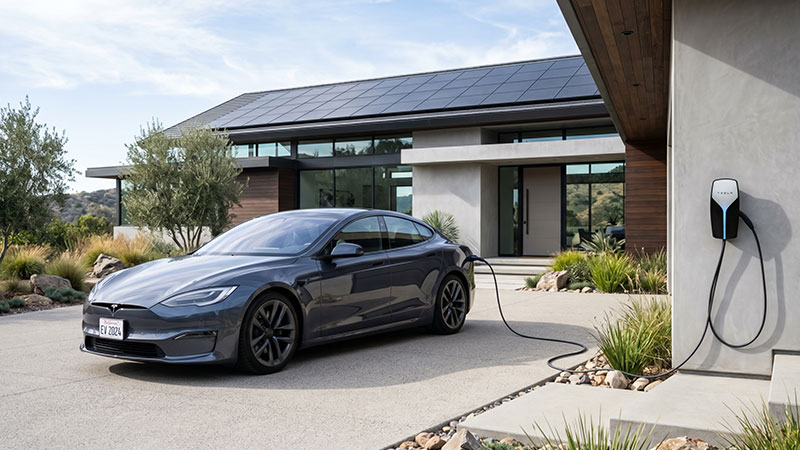
The convergence of electric vehicles (EVs) and residential photovoltaic systems represents the ultimate milestone in personal energy independence. Operating an electric car inherently removes your reliance on fossil fuels, but plugging into the traditional utility grid simply shifts your financial liabilities from the gas pump straight to your monthly electric bill.
By capturing raw solar energy from your roof and routing it directly into your vehicle's battery pack, you effectively build a private fuel station that operates at a fraction of the cost of commercial utility grids in 2026.
The Pure Math: Grid Power vs. Solar Generation Infrastructure
To understand the exact scope of your potential return on investment (ROI), we must break down the baseline performance numbers. The average electric vehicle operational efficiency sits at approximately 3 miles per kilowatt-hour (kWh).
If your typical driving patterns demand 12,000 miles of travel per year, your vehicle will consume roughly 4,000 kWh of electrical energy annually. Let us look at how the financial liabilities stack up under different energy sourcing models:
- The Grid Power Matrix: At a standard national utility average rate of $0.18 per kWh, drawing 4,000 kWh entirely from the grid translates to $720 annually in pure charging costs. In high-tariff tiers like California or parts of Europe where rates reach $0.34 to £0.32 per kWh, this cost immediately spikes to $1,360+ per year.
- The Solar Sourcing Blueprint: Residential solar energy has a Levelized Cost of Energy (LCOE) of roughly $0.06 to $0.08 per kWh over the lifecycle of the system. Powering those same 12,000 miles with home-grown solar energy drops your operational expenditure down to just $240 to $320 per year.
This delta creates an immediate, locked-in annual saving of $400 to over $1,000 on transportation fuel alone, heavily compressing the payback timeline of your complete solar infrastructure.
Regional Variance: Capitalizing on Local Tariff Structures
Your geographic location and regional grid mechanics heavily influence the velocity of your savings framework in 2026.
1. High-Tariff Zones (e.g., California, Northeast US, United Kingdom): Regions with steep retail electricity prices or complex Time-of-Use (TOU) frameworks deliver the fastest investment recovery. Saving against a $0.34/kWh retail rate means every unit of self-generated power yields massive relative capital retention. Homeowners looking to navigate these regional pricing changes can track financial benchmarks using our detailed guide for Solar Grants in Visalia.
2. Standard Tariff Zones: Even in regions with lower utility baselines, coupling your solar array with an EV ensures protection against future inflationary utility price hikes, anchoring your long-term household budget safely.
System Sizing Framework: Allocating Panel Capacity for EV Demands
When configuring your solar infrastructure using our advanced planning calculators, you must explicitly account for your vehicle's energy appetite. A common mistake is sizing the system purely based on historical household appliance consumption, leaving no overhead for automotive charging.
To offset 4,000 kWh of annual EV charging demand, you need to scale your system's raw capacity. Depending on your local peak sun hours, this typically requires adding an extra 1.2 kW to 2 kW of solar panel capacity to your overall array blueprint. This translates to roughly 3 to 5 additional high-efficiency physical panel modules dedicated entirely to fueling your car. You can check how these hardware adjustments affect your overall setup budget by mapping the average Solar Panel Cost in San Francisco.
Long-Term Capital Appreciation & Economic Freedom
Beyond the immediate monthly budget relief, feeding your EV with solar power establishes a fully decoupled economic loop. As utility providers continue to adjust grid infrastructure margins and raise retail distribution fees, your home-generated fuel matrix remains completely fixed at zero marginal cost. To run your own exact localized figures and numbers, you can easily calculate your potential savings pattern using a dynamic Solar Calculator in Norwalk.
Over a standard 10-year automotive ownership cycle, this continuous capital retention easily accumulates to $5,000 - $10,000 in direct savings, transforming your clean energy investment into a powerful compound financial asset.